Men's T20 World Cup MVPs (2007-2010)
Looking back at the best players in the first three editions of the T20 World Cup with the knowledge of today.

Fans and cricketers saw it as a joke when the first men's T20 international took place between Australia and New Zealand.

When the first men's T20 WC rolled around, no one knew what to do or who to pick. Australia chose their ODI team, England tried a bunch of their best players from the Blast, and India’s main players decided to take a break. This format was a math equation no one had a clue about. This clearly isn’t the situation now.
We now have analysts, specialist T20 players, countless hours of videos on every player and detailed strategies with meticulous plans. But those early T20 World Cups didn’t have these things, and often the way we looked at them back then was with little knowledge of the format.
In this series, we look back at the best players in each edition of the world cup with the knowledge of today. This means re-examining some of the well-known campaigns, but also shining a light on others that weren’t given much respect.
The majority of the metrics we are using are contextual. Because when you do something in T20 makes a huge difference.
We start with the true average and true strike rate. If you are a middle-order batter you are expected to have a high average since you bat in the low-risk overs. But if you’re a finisher, you will go from ball one and be dismissed more often. So we factor these things in to come up with a true average.
Likewise, if you bat in the middle overs, a strike rate of 140 is really good but the same strike rate at the death is seen as very poor. It’s this difference that we want to account for with true strike rate.
We do the same kind of thing with the bowlers. Being economical in the middle is easy, as is taking wickets at the death. Hence, we have true economy rate and true wickets per four overs.
One thing we should point out is that unlike our IPL MVP videos, we’ll see a far greater disparity of true values here. This is because in an IPL season, we are looking at 14 to 17 games for a player, whereas it’s half that for T20 WCs.
We’re looking for the best outliers, and most dominant players in the T20 WCs so far.
2007
Batting
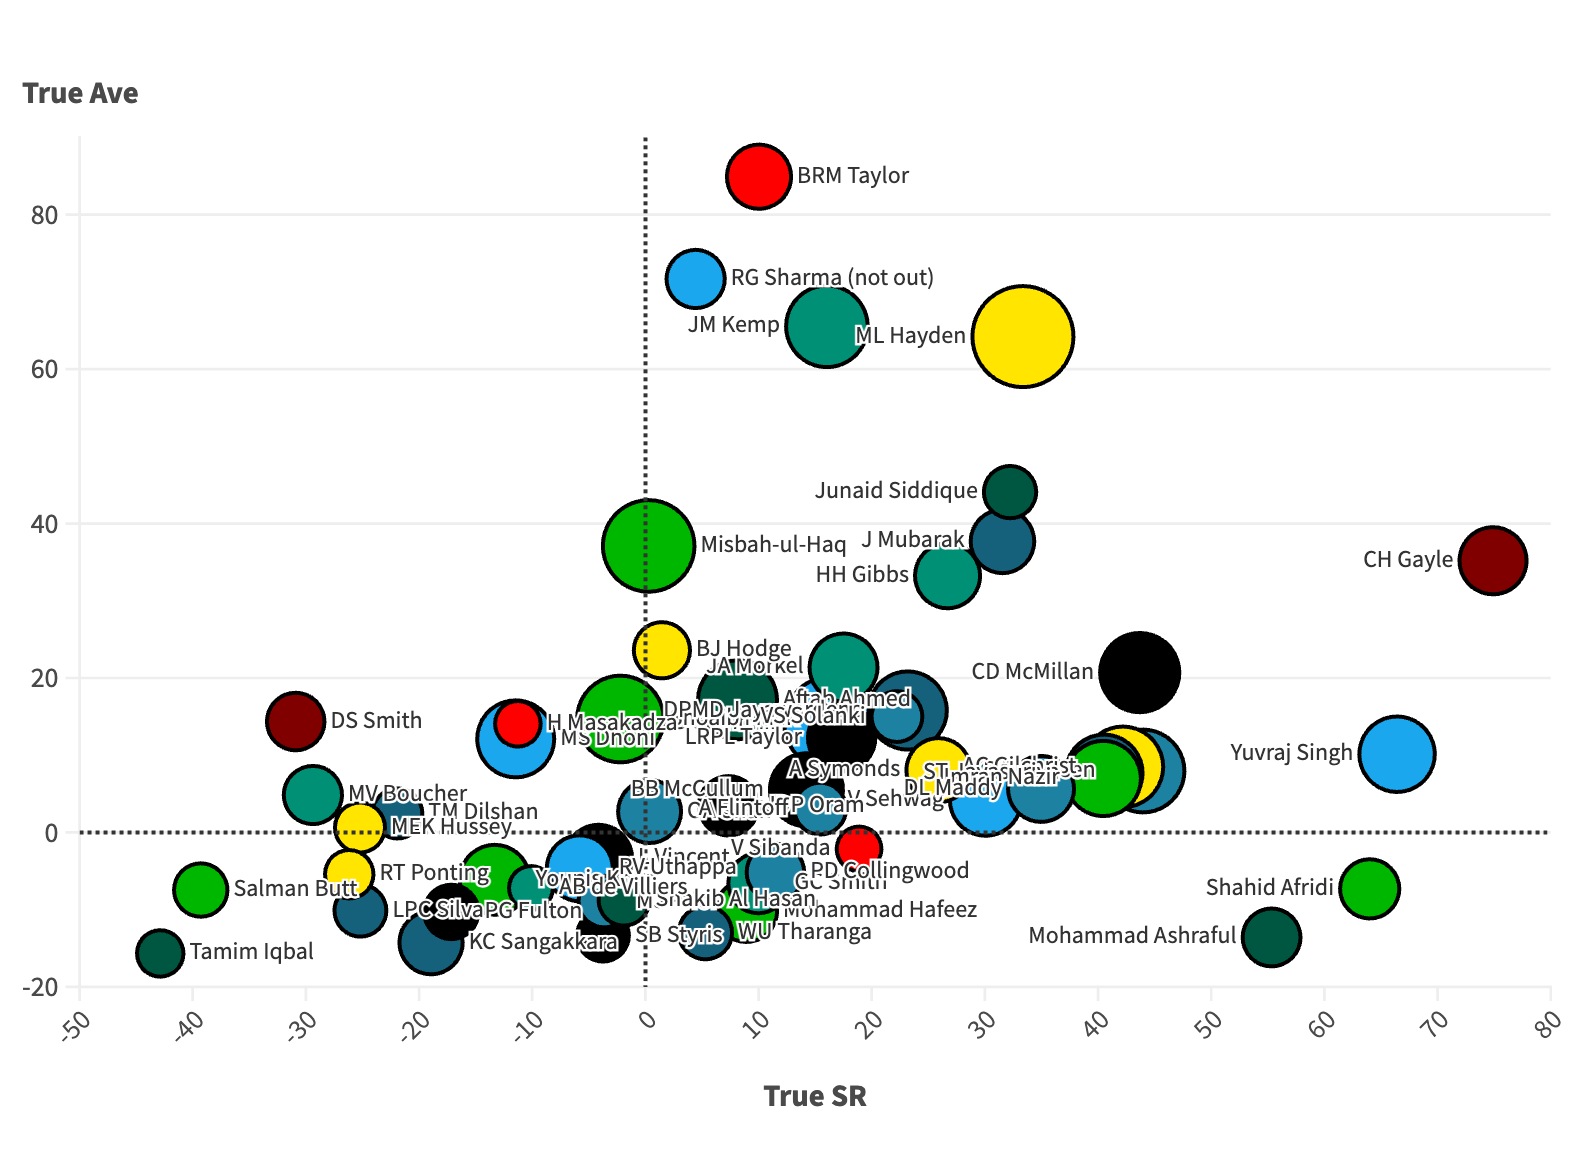
Let’s start with the inaugural T20 WC. In terms of true average, Brendon Taylor tops it. He had a pretty good tournament, especially since he didn’t play for a very good team. He only played two innings, a match-winning 60* off 45 balls vs Australia and 47 off 39 balls vs England in a losing cause.
Rohit Sharma was pretty good in this tournament as well; he had a true average of 72. He scored an unbeaten 50 off 40 balls against South Africa when the chips were down at 33 for 3, but his most memorable contribution came in the final where he finished not out with a 16-ball 30.
Matthew Hayden led the run-scorers chart and also does very well on our advanced metrics. 265 runs with a true average of 64 and a true strike rate of 33. Justin Kemp is probably the surprise package here, he mainly batted at number four and had a really good campaign with 173 runs at a true average of 66 and a true strike rate of 16.
In terms of true strike rate, Gayle, Yuvraj, Afridi and Ashraful stand clear of everyone. Especially Gayle, showing us glimpses of what he would do in this format in the near future. A true strike rate of 75 and a true average of 35.18. Although he only played two innings – scoring 117 in one and 0 in the other.
Ashraful is probably the surprising one here with a true strike rate of 55.44, but the negative true average suggests he did not score enough runs. He started the tournament with a 61 off 27 versus the West Indies but had a string of low scores afterwards.
Yuvraj Singh is probably the one you’ve been waiting for. We all know that his six sixes vs Broad is part of cricketing folklore. And the advanced numbers don’t disappoint. 148 runs with a true average of 10 and a true strike rate of 66. He was brilliant this WC.
And we’ve left the freak for the last, Shahid Afridi. He had a true average of -7.3 and a true strike rate of 64. He understood T20 cricket in a way none of us did at the time. Everyone looked at his average of 15, but no one respected that strike rate of 198.
Bowling
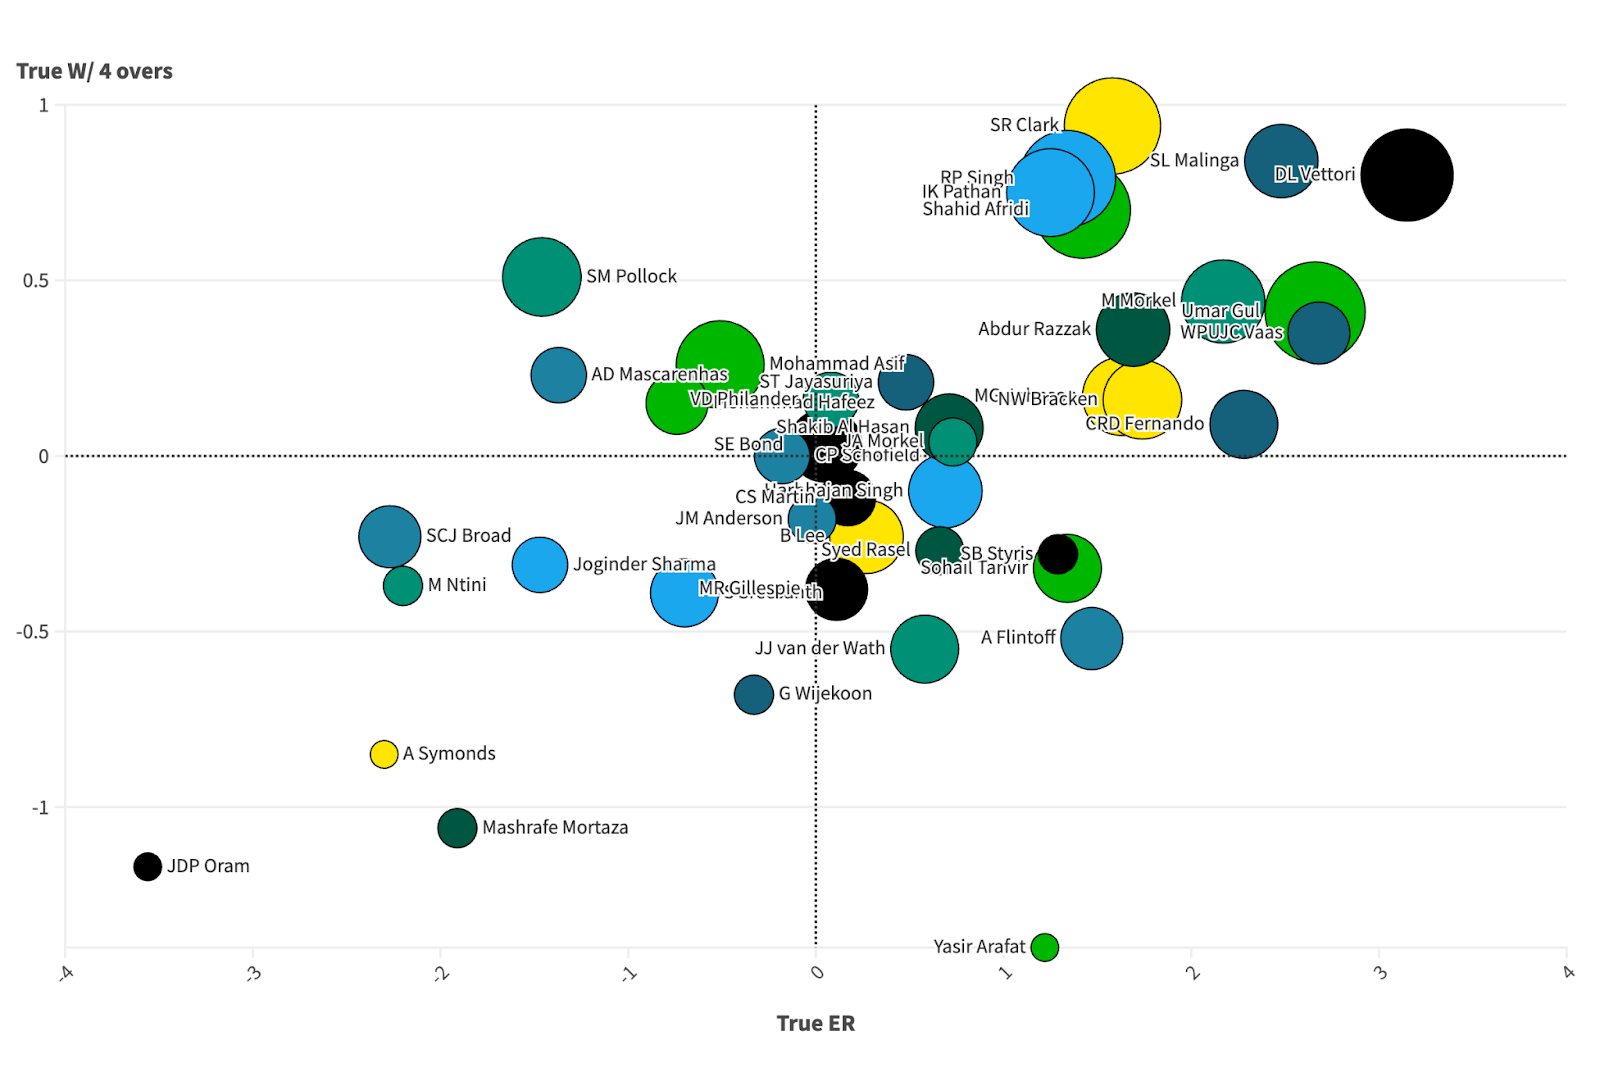
Daniel Vettori probably doesn’t get recognition for how good he was in this tournament. He was absolutely unreal, with a true economy rate of 3.15 and 0.8 true wickets per four overs. If you don’t like our advanced numbers, that’s fine. He took 11 wickets at an economy rate of 5.33 and an average of 11.64. Not bad for a finger spinner in South Africa.
Alongside him is Lasith Malinga, who we do expect here as he dominated T20 cricket for the next decade. He took seven wickets with a true economy rate of 2.48, picking 0.84 wickets per four over spell more than expected.
Let’s briefly mention the leading wicket-taker, Umar Gul. He took 13 wickets at a true economy rate of 2.66 and 0.41 true wickets per four overs. After him, we see a cluster of Stuart Clark, Irfan Pathan, Shahid Afridi and RP Singh. Stuart Clark is an interesting one to look at; he took 12 wickets at a true economy rate of 1.58 and 0.94 true wickets per four overs. Stuart Clark was never seen as a white ball bowler, but he actually did very well in both formats.
RP Singh and Irfan Pathan took 12 and 10 wickets respectively this WT20 with a true economy rate of around 1.3 and a true wickets per four overs of around 0.75. In a World Cup where the Indian batters get a lot of limelight, these two had campaigns that just aren’t rated highly enough for a winning side.
But let’s talk about the actual player of the tournament, Shahid Afridi. He scored 91 runs and had a true average of -7.3 and a true strike rate of 64. He took 12 wickets with a true economy of 1.42 and 0.7 true wickets per four overs with the ball. Afridi was a frontline bowler and a very good batter. He might not have given you a high volume of runs but he definitely gave you impact.

2009
Batting

Let’s look at the next T20 World Cup. We have three outliers here: Angelo Mathews and Jacques Kallis with the true average, and Junaid Siddique with the true strike rate. These are probably not the names you were looking for.
Many forget that Angelo Mathews during his younger years was a fantastic player. In the 2009 T20 World Cup, he was to Sri Lanka what Dhoni was to Chennai in IPL 2024 – a finisher in the truest sense. His median entry point was 18.2 overs. He scored 75 runs with a true average of 61 and a true strike rate of 8.
Let’s look at the other man, Kallis. Not only was he brilliant in terms of true average (53 to be precise), he also had a very respectable true strike rate of 7 in this tournament. This was not always the case with him.
In the next cluster, we have Younis, Dilshan, and Gayle. Younis Khan was absolutely brilliant this World Cup. He scored 172 runs with a true average of 39 and a true strike rate of 22. Although he was Pakistan’s captain in the tournament, he was never known for being a quick scorer. He really turned it up this World Cup and was instrumental in the title win.
Dilshan was the top run scorer of the tournament and the advance metrics support his case as well – 317 runs with a true average of 30 and a true strike rate of 31. It was also the first of the Dilscoop, which certainly helped. And finally Gayle. Although not as dominant as his first T20 World Cup, it’s a much larger sample size and he was still brilliant this time – 193 runs with a true average of 27 and a true strike rate of 17. He hit Brett Lee into the Archbishop Tenison's School next to the Oval.
Let’s look at true strike rates for a minute. Junaid Siddique had a great true strike rate, though he only played two innings. Aaron Redmond also has a fantastic true strike rate of 58. There are two names you might recognise, AB De Villiers and Yuvraj Singh. Yuvraj’s name features here in two T20 World Cups in a row. Although not as dominant in terms of true strike rate as his 2007 campaign, he was still plus 38. He had a true average of 19, which was better than last time. AB De Villiers also had similar numbers, a true average of 19 and a true strike rate of 34.
Bowling

We have two outliers here – Pragyan Ojha and Wayne Parnell.
The South African seamer had a ridiculous true economy rate of 3.2 in this tournament. He was more than 3 runs per over better than expected on our metrics, and was slightly above par on true wickets. Pragyan Ojha took 1.29 wickets more per four over spell and had a true economy rate of 0.36, which is a very unusual split for an SLA. He also had an MVP level season in the IPL that year. At his best, he was brilliant.
In the next cluster, we have a bunch of bowlers grouped together. Mendis, Gul, Ajmal, Razzaq, van der Merwe and Afridi.
Before he played for Netherlands and made it his life’s mission to beat South Africa, van der Merwe was brilliant for his home country in 2009. He had a true economy rate of 1.64 and 0.61 true wickets per four overs, which makes a lot more sense for an SLA.
Umar Gul had dominated early T20 cricket and was brilliant in the first two T20 World Cups. He was the leading wicket taker, and he took 0.43 wickets more per four overs along with a true economy rate of 1.93. His teammate Ajmal also did really well – 0.19 wickets more per four overs and a true economy rate of 1.85.
Let’s talk about Afridi, because he’s our MVP again. He keeps finding his way here. 176 runs at a true average of 13 and a true strike rate of 24 with the bat. And 11 wickets at a true economy rate of 1.57 and 0.53 true wickets per four overs with the ball. A superfecta.
He missed it by one last season, but has got a positive outcome on all our advanced metrics. He was clearly the player who made the biggest impact on the most important games.

2010
Batting
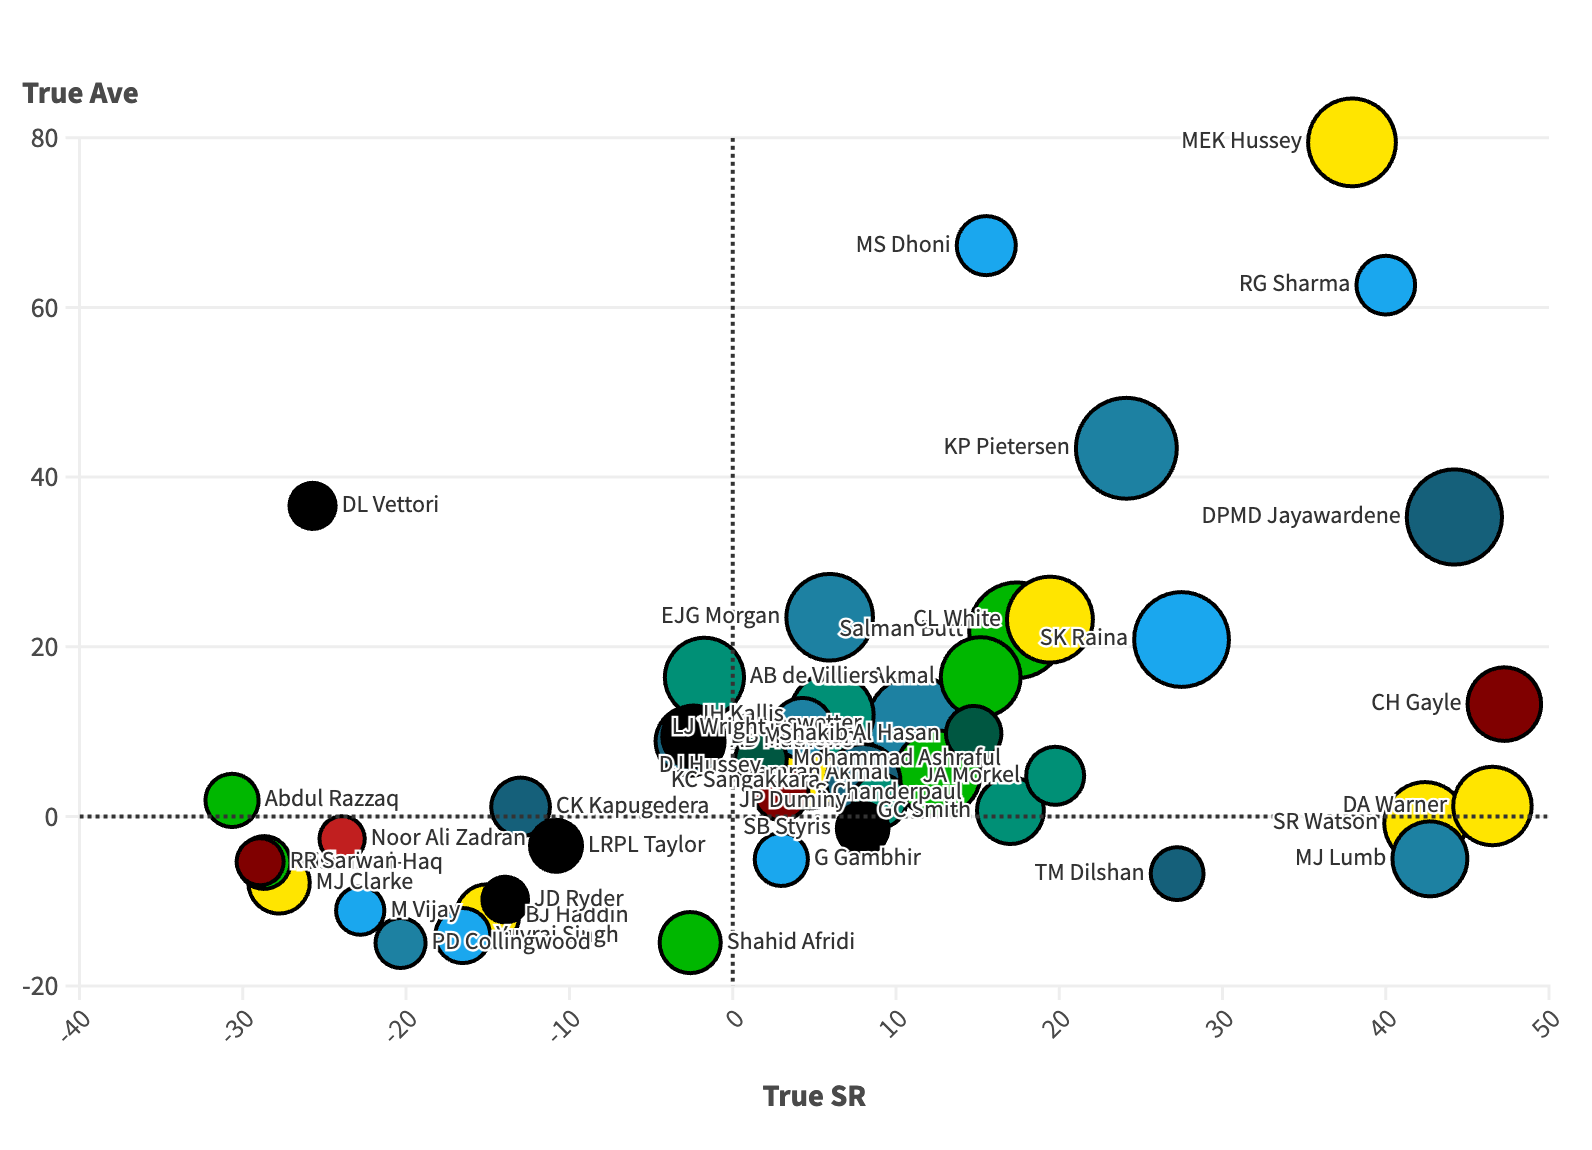
Michael Clarke called Mike Hussey “a freak” after he scored an unbeaten 60 off 24 balls against Pakistan in the semi-final. He is an outlier both in terms of true average and true strike rate – 188 runs at a true average of 80 and a true strike rate of 38. He was at the height of his powers during this period, and quite frankly was a major reason why Australia reached the final.
We have a great cluster of batters near the far right of true strike rate. Jayawardene, Rohit, Gayle, Warner, Watson and Lumb. Warner, Watson and Lumb had a great true strike rate and did it at a par true average.
Gayle had an exceptional T20 WC again. Jayawardene is the only batter along with Virat Kohli to have scored over 1000 runs in T20 World Cups. In this edition, he had a true average of 35 and a true strike rate of 44. Rohit Sharma was also quite good here, although he only played two innings.
MS Dhoni has a high true average, which means he had a lot of not outs. But for the first time in a T20 WC, he had a positive true strike rate. However, he did not have a great impact in the two innings where he faced more than 15 balls.
Let’s talk about the leading run-scorer, Kevin Pietersen. He was brilliant in the early T20 WC campaigns, and this one is no different. A true average of 43 and a true strike rate of 24. He also showed up with quick-fire 40s in the semi-final and final and played a key role in England’s first major trophy in men’s cricket. He won England their first World Cup, but the only issue is that it wasn’t called a World Cup then.
Bowling
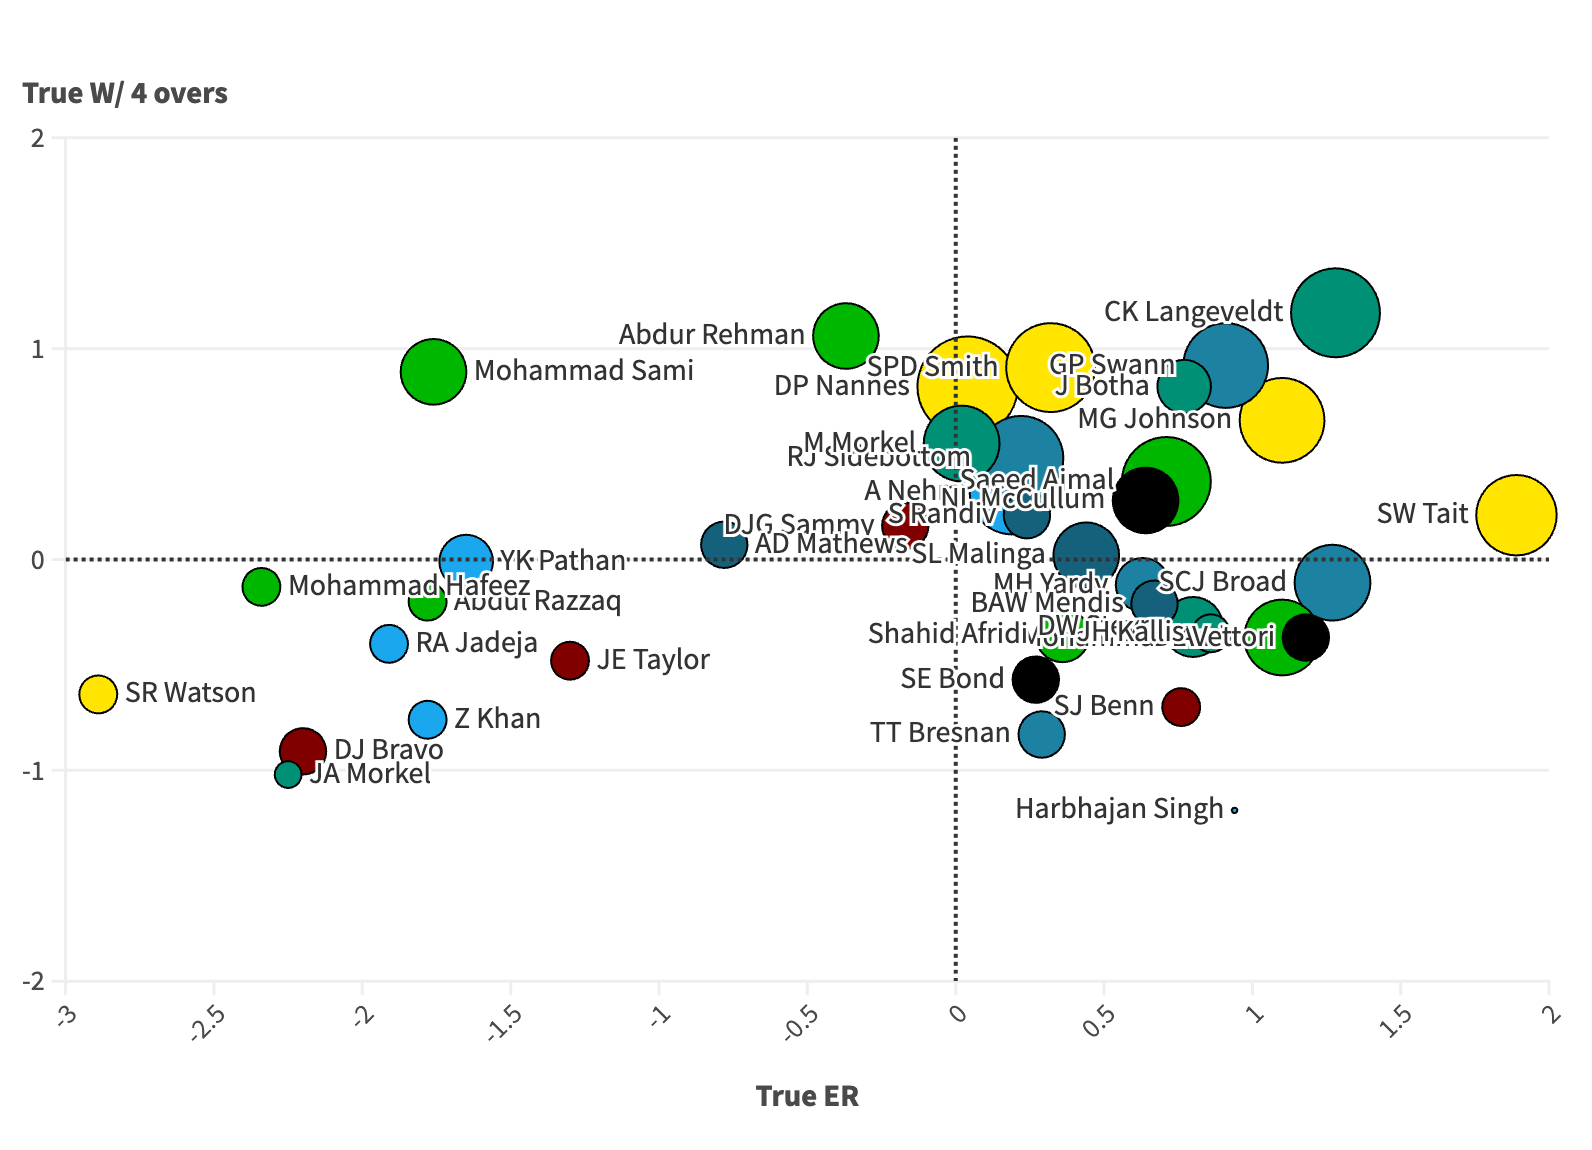
Shaun Tait is a clear outlier here, but not in the way you’d expect. If I told you Tait had a good WC, you’d probably think he took a lot of wickets and went for loads of runs. But the opposite happened here. He was essentially a par wicket taker but was nearly two runs per over better than expected.
Charl Langeveldt was brilliant in this WT20, with a true economy rate of 1.28 and true wickets per four overs of 1.17. Right near him, we also see Johan Botha and Graeme Swann. Both of them outbowled Saeed Ajmal in this tournament. Swann had a true economy rate of 0.91 and took 0.92 wickets more per four over spell as well. A remarkable season. Mitch Johnson again had a great WC, he was also very good in 2007. He probably is someone who was a much better T20 bowler than we give him credit for.
Now here’s another name that might surprise you. Steven “Best since Bradman” Smith. No, you’re not looking at the wrong graph. He was still bowling back then, and in this T20 World Cup, he did quite well. He took 0.91 wickets more per four overs than expected at a true economy rate of 0.32.
Our MVP for this season is Mike Hussey. As a reminder, he scored 188 runs with a true average of 80 and a true sr of 38. He had a median entry point of 14.2 overs and yet only scored 60 runs less than KP who came in to bat at the four over mark. A truly MVP caliber season by Hussey.

This is the first part of our series, so make sure you don’t miss a single MVP worthy performance.


