Men's T20 World Cup MVPs (2021-22)
They even changed the name to the World Cup, after all those years of us calling it that when it wasn’t.


2021 was the first World Cup when people actually understood T20 cricket. They even changed the name to the World Cup, after all those years of us calling it that when it wasn’t. This means that England had won a men's World Cup, and we didn’t know it. So this was their second T20 World Cup victory, but their first actual T20 World Cup. Australia also waited until it was called a World Cup to win it, thereby winning all major ICC white ball trophies in both men’s and women’s cricket.
Remember we look at players' true values, which are contextual numbers based on the ground, match situation and innings phase.
2021
Batting
Let’s talk about one of the more recent World Cups. 2021.
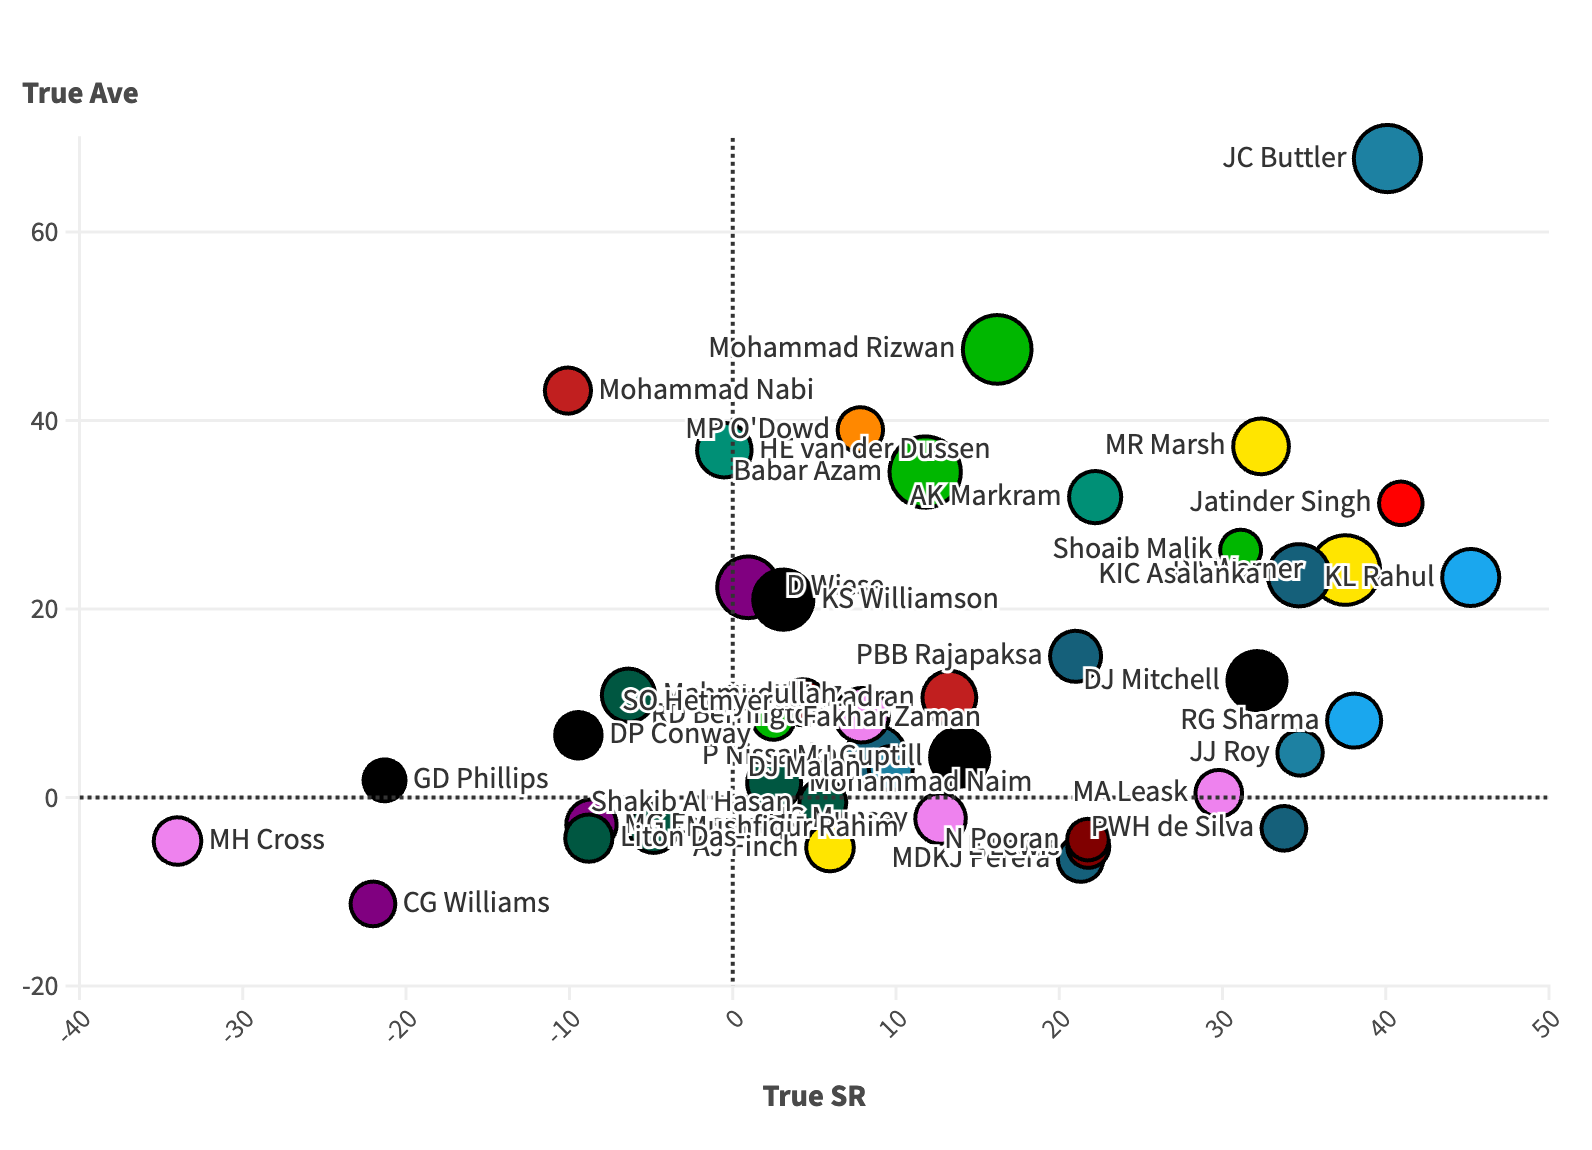
We have a clear outlier here. Jos Buttler was clearly the best batter in this season. He scored 269 runs with a true average of 68 and a true strike rate of 40. He possibly had one of the greatest batting performances ever. But again, if we have to nitpick - he was slow in the semi-final against New Zealand. He scored 29 off 24 balls, and the Kiwis were able to chase it down.
On the true strike rate extreme, we have KL Rahul. Which is amusing when you think about how much hate he gets for being slow. Although we do have to mention that he didn’t score runs versus NZ and Pakistan and had three relatively quick 50s versus Afghanistan, Namibia and Scotland. We made a video about how doesn’t mean he only makes runs against these teams, because of that one time it happened.
In the cluster near him, we have David Warner and Charith Asalanka. Warner was the 2nd highest run scorer in this edition. he scored 289 runs with a true average of 24 and a true strike rate of 38.
Asalanka probably didn’t get enough credit for how good he was in this World Cup. He had scored 231 runs with a true average of 24 and a true strike rate of 35. Very close to Warner in terms of true values. But we do need to remember that Warner also scored runs in the semi-final and the final.
Mohammad Rizwan does very well in terms of true average. A fact that should surprise no one. He had a true average of 48 and a true strike rate of 16. The true strike rate would be a surprise since we don’t associate him with being a fast scorer. But we have to remember that World Cups in general are turgid. So Rizwan might be a slow anchor in regular T20 cricket, but in World Cups he’s probably par or in this case above par. But in the semi-final, he faced 52 balls to score 67 runs.
Near him we also see names that we expect to see – Rassie van der Dussen, Babar Azam and Max O'Dowd.
Let’s talk about Babar for a minute. He was the leading run scorer of the tournament, scoring 303 runs with a true average of 35 and a true strike rate of 12. Like Rizwan, his strike rate issues aren’t as prevalent in T20 World Cups since they are very low-scoring. But his innings against Australia (where he made 39 off 34) in the semi-final showed us the flaw in playing catchup innings.
O’Dowd had a pretty good campaign with a true ave of 39 and a true strike rate of 8. Netherlands didn’t manage to make it to the super 12s but he was still brilliant.
Bowling
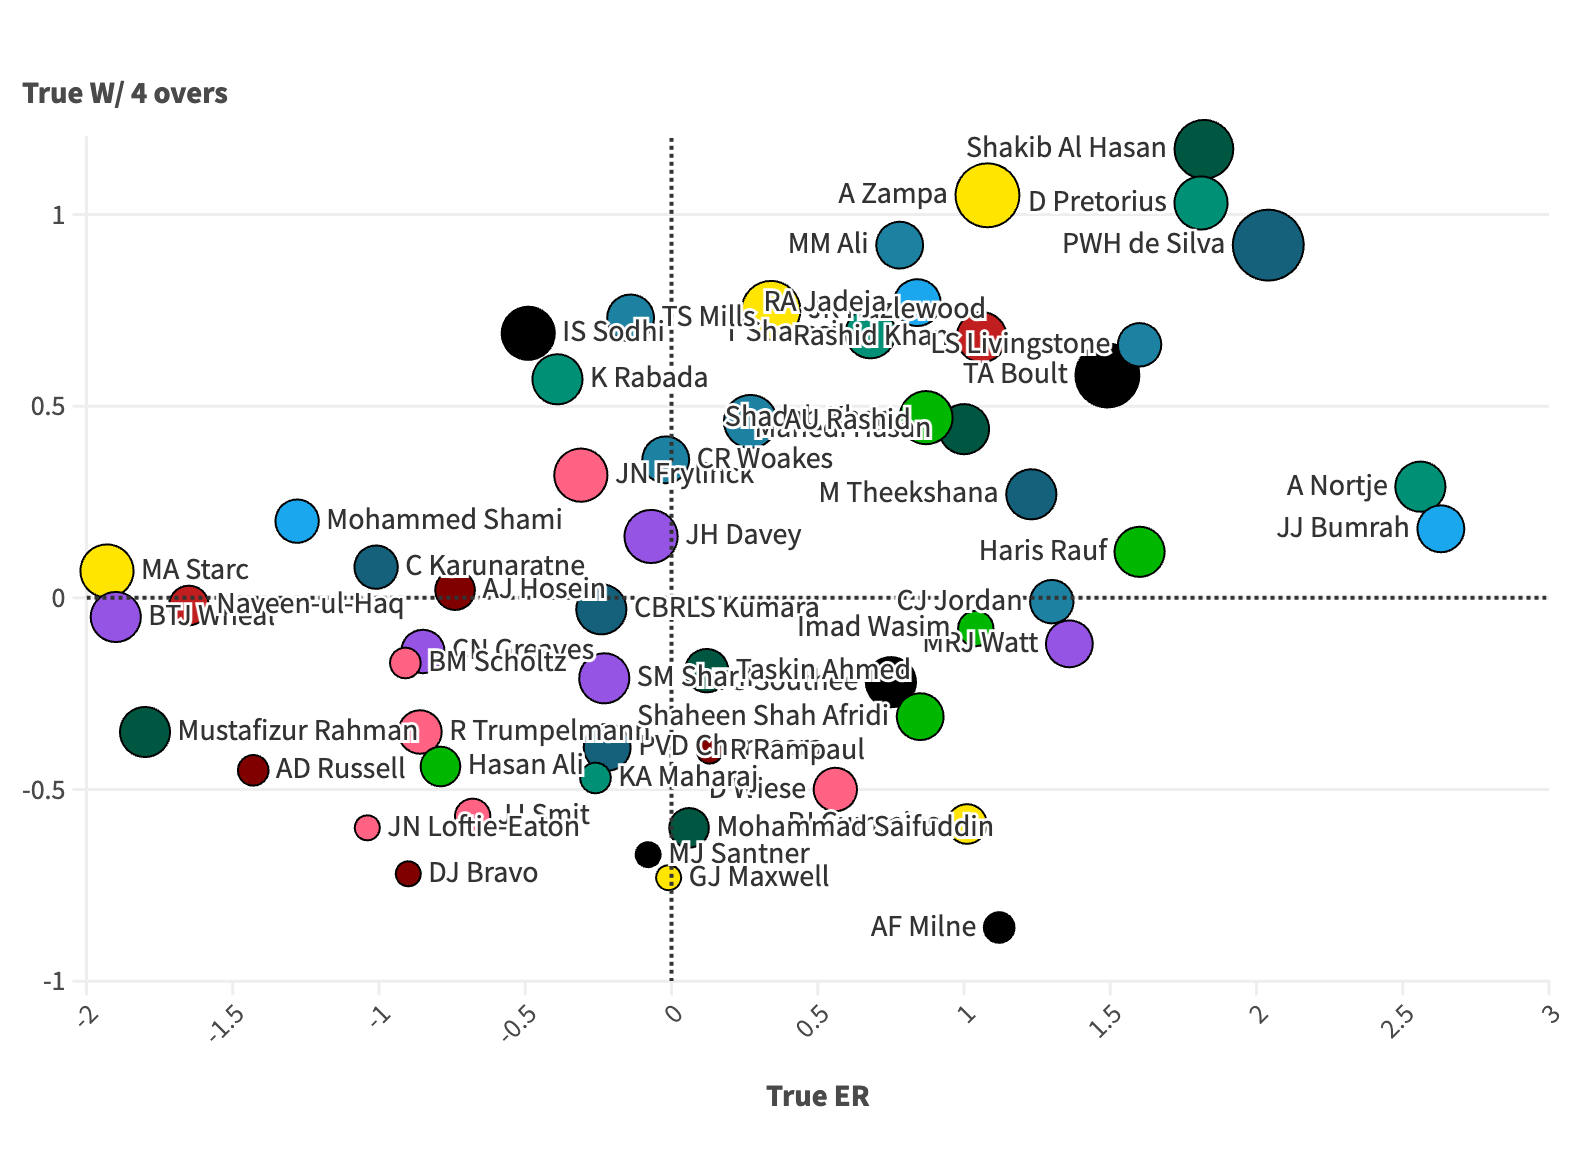
There are a few outliers here. This was a World Cup largely dominated by spinners but we still see some pacers do well here. Anrich Nortje and Jasprit Bumrah had very economical seasons. Nortje took 8 wickets with a true economy rate of 2.56 and 0.29 true wickets per four overs, while Bumrah took 7 wickets with a true economy rate of 2.63 and 0,18 true wickets per four overs.
Shakib Al Hasan had a fantastic bowling season. He took 11 wickets with a true economy rate of 1.82 and 1.17 true wickets per four overs. Absolutely brilliant on both fronts. Near him we see Dwayne Pretorius, Adam Zampa and Wanindu Hasaranga. The pitches we saw in the UAE really suited Pretorius who’s a slow ball bowler. He took 9 wickets at a true economy rate of 1.81, while taking one wicket more per four over spell.
Zampa took 13 wickets with a true economy rate of 1.08 and 1.05 true wickets per four overs. He was the joint second-highest wicket taker and was instrumental in Australia’s win.
In the cluster near him, we have a bunch of spinners. However, I’m gonna talk about Liam Livingstone, who’s on the same tier as Rashid Khan, Ravindra Jadeja and Tabraiz Shamsi. He took 6 wickets with a true economy rate of 1.6 and 0.66 true wickets per four overs.
Let’s finally talk about the leading wicket-taker, Hasaranga. He took 16 wickets with a true economy rate of 2.04 and 0.92 true wickets per four overs. It was an exceptional tournament for him. The reason we’re talking about him now is that he’s also our MVP for this wc. On top of being an elite bowler, he also scored 119 runs with a true average of -3 and a true strike rate of 34.
This season doesn’t get the hype it deserves because people look at teams he played and assume that he only does well against the weak teams. That was absolutely not the case. The one bad game he had was versus Bangladesh, where he was 0-29 in 3 overs. Other than that he took a wicket in every game and didn’t go for more than 6 an over. His batting is not as impressive, but with a bowling season like that he didn’t need to bat for him to be our MVP. So any runs from him is a bonus.

2022
Batting

Virat Kohli and Finn Allen are the two biggest outliers here. Allen started the tournament by smashing the ball everywhere against Australia. When you think of Kohli in that T20 World Cup, you remember him for what he did at the MCG, especially that six.
Throughout the tournament, he displayed his elite wicket-preservation skills. He finished as the top run-scorer, but his fifty against England in the semi-final was suboptimal. Buttler and Hales, who knocked that target off comfortably, had very high true strike rates and were also among the top run-getters.
And then we have Suryakumar Yadav, who was a massive outlier on both true average and true strike rate – a true average of 43 and a true strike rate of 67. His innings against South Africa in Perth came when none of the Indian batters could stay in the middle is not talked about enough because India lost the match.
De Kock, Rossouw, Shadab had great high true strike rate seasons, scoring over 0.5 runs per ball more than expected. However, the two South African batters did not score a lot of runs against India, Pakistan and Netherlands in their group. Shadab’s innings against South Africa was the start of something special for Pakistan, who reached the finals despite losing their first two matches.
Kusal Mendis had a high true strike rate at a well above par true average. But his performances in the Super 12 (except 68 against Ireland) were underwhelming. Glenn Phillips had an even better season. His century against Sri Lanka from 7 for 2 (and then 15 for 3) was followed by a brilliant 62 against England.
The Aussie duo of Glenn Maxwell and Marcus Stoinis scored quickly, despite the team not reaching the semi-finals at home. David Miller and Brandon King scored at par strike rates without getting out.
Bowling

Anrich Nortje is a cut above the rest here. He was number one on true economy as well as true wickets per four overs. He conceded 1.26 runs per over less than expected, and took 2.27 wickets more per four over spell. He was a standout performer in what was a disappointing campaign for South Africa.
Sam Curran bowled well in the powerplay, but he was one of the best death bowlers in the tournament. He had a true economy of 0.86 and 1.56 true wickets per four overs. Tim Southee was another seamer who had a great run. He had the third-best true economy of any bowler in the tournament, while also taking 0.41 wickets more per four overs.
Bas de Leede was only behind Nortje, Wood, and Curran as far as true wickets are concerned. Wood was slightly more expensive than par, but he took 0.95 wickets more per four-over spell.
But it was not just about pace. Sikandar Raza, Mitchell Santner, Shadab Khan, and Wanindu Hasaranga – all had great campaigns in terms of wicket-taking as well as run-preservation. It is incredible that we have an offspinner, a left-arm finger spinner, and two legspinners here.
There were a few players that had a great case. But we have come down to four names – Curran, Shadab, Raza and Nortje.
Curran was ICC’s POTT, which I didn’t think at the time was right, and I kind of still don’t. But looking at these numbers it makes more sense. But there isn’t really a clear-cut winner of this. So it does make more sense. Nortje took loads of wickets and nobody could hit him. And Raza was a plus player on all four of our metrics, but was probably shy of the best player.
But our MVP is Shadab Khan. Like Raza, he was also above par in all four aspects. A true average of 8 and a true strike rate of 50 combined with a true economy of 0.69 and 0.94 wickets more per four overs. Incredible to think that not long ago he was a star, and now he’s struggling to hold his place.

That’s it for our T20 World Cup MVP series.