Men's T20 World Cup MVPs (2012-16)
Looking at the well-known campaigns as well as the slightly forgotten ones with the lens of true values.

This is when T20 got really fun. These three men's T20 World Cups are remembered for the dominance of West Indies, despite the fact that we had all written them off as a cricket force by then. They were held in Sri Lanka, Bangladesh, and India respectively – so the conditions now were a lot different from what we had in the first three editions. 2012 was when we started to see the change in mindset and approach for teams. You felt that teams were taking the format far more seriously than they did in the early editions. And there was a far better understanding of the format, with both the World T20 and the format being more established.
So what we do is look at the well-known campaigns as well as the slightly forgotten ones with the lens of true values. Yes, Virat Kohli will be here. But I promise you, so will the cricketers you have largely forgotten and will be very random at the least. We do all this looking at true values of the players rather than the conventional metrics of the time.
2012
Batting
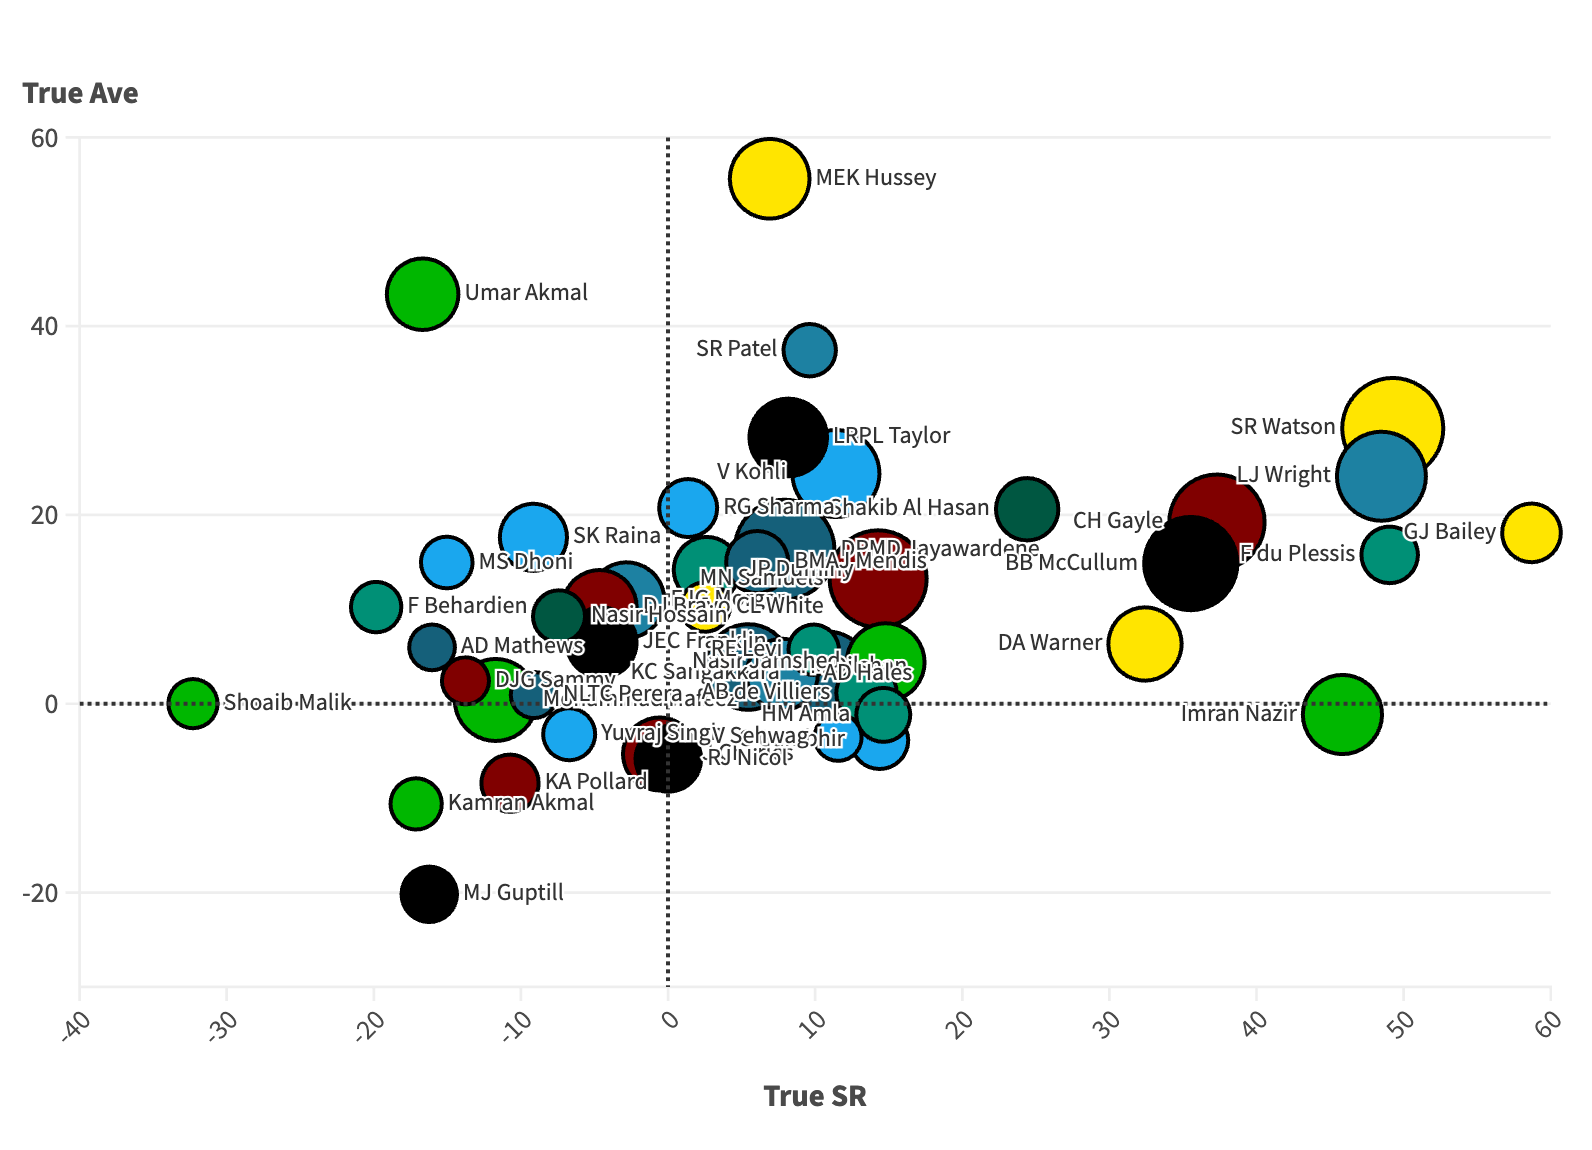
There are a couple of outliers here – Mike Hussey and George Bailey. Hussey played a different role in this particular world cup, coming in at a median over of 3.2. He scored 155 runs at a true average of 56 and a true strike rate of 7. In the next cluster, we have Samit Patel. Don’t throw your phones away. He’s only played one innings.
Close to him we have Virat Kohli and Ross Taylor. Kohli had a true average of 24 and a true strike rate of 11, Taylor had a true strike rate of 8 and a true average of 28. Both had decent seasons. Umar Akmal did manage a high true average of 43, but he did at a massive hit to true strike rate.
On the true strike rate side, we have Bailey. He had a true strike rate of 59 and a true average of 18, though he only scored 84 runs in three innings. In the next tier, we have Shane Watson, Luke Wright, Faf du Plessis and Imran Nazir.
Watson was the leading run scorer of the tournament and his advance numbers further helped his case. 249 runs with a true average of 29 and a true strike rate of 49.
Wright was possibly one of the most underrated T20 players ever. This was mainly because he was really good at T20 cricket when England were really rubbish. Even in this T20 World Cup, he scored 193 runs with a true average of 24 and a true strike rate of 48. It was an MVP quality season that doesn’t get talked about enough.
Imran Nazir had a very Afridi-esque season.He had a slightly below par true average of -1.14 but had a true strike rate of 45.84. He opened the batting for Pakistan and was really good for them. It’s unfortunate that his illness prevented us from seeing the best of him in this format.
Gayle, McCullum and Warner also do really well. Gayle and Baz were two batters that really dominated early T20 cricket before anyone understood what it was.
Bowling
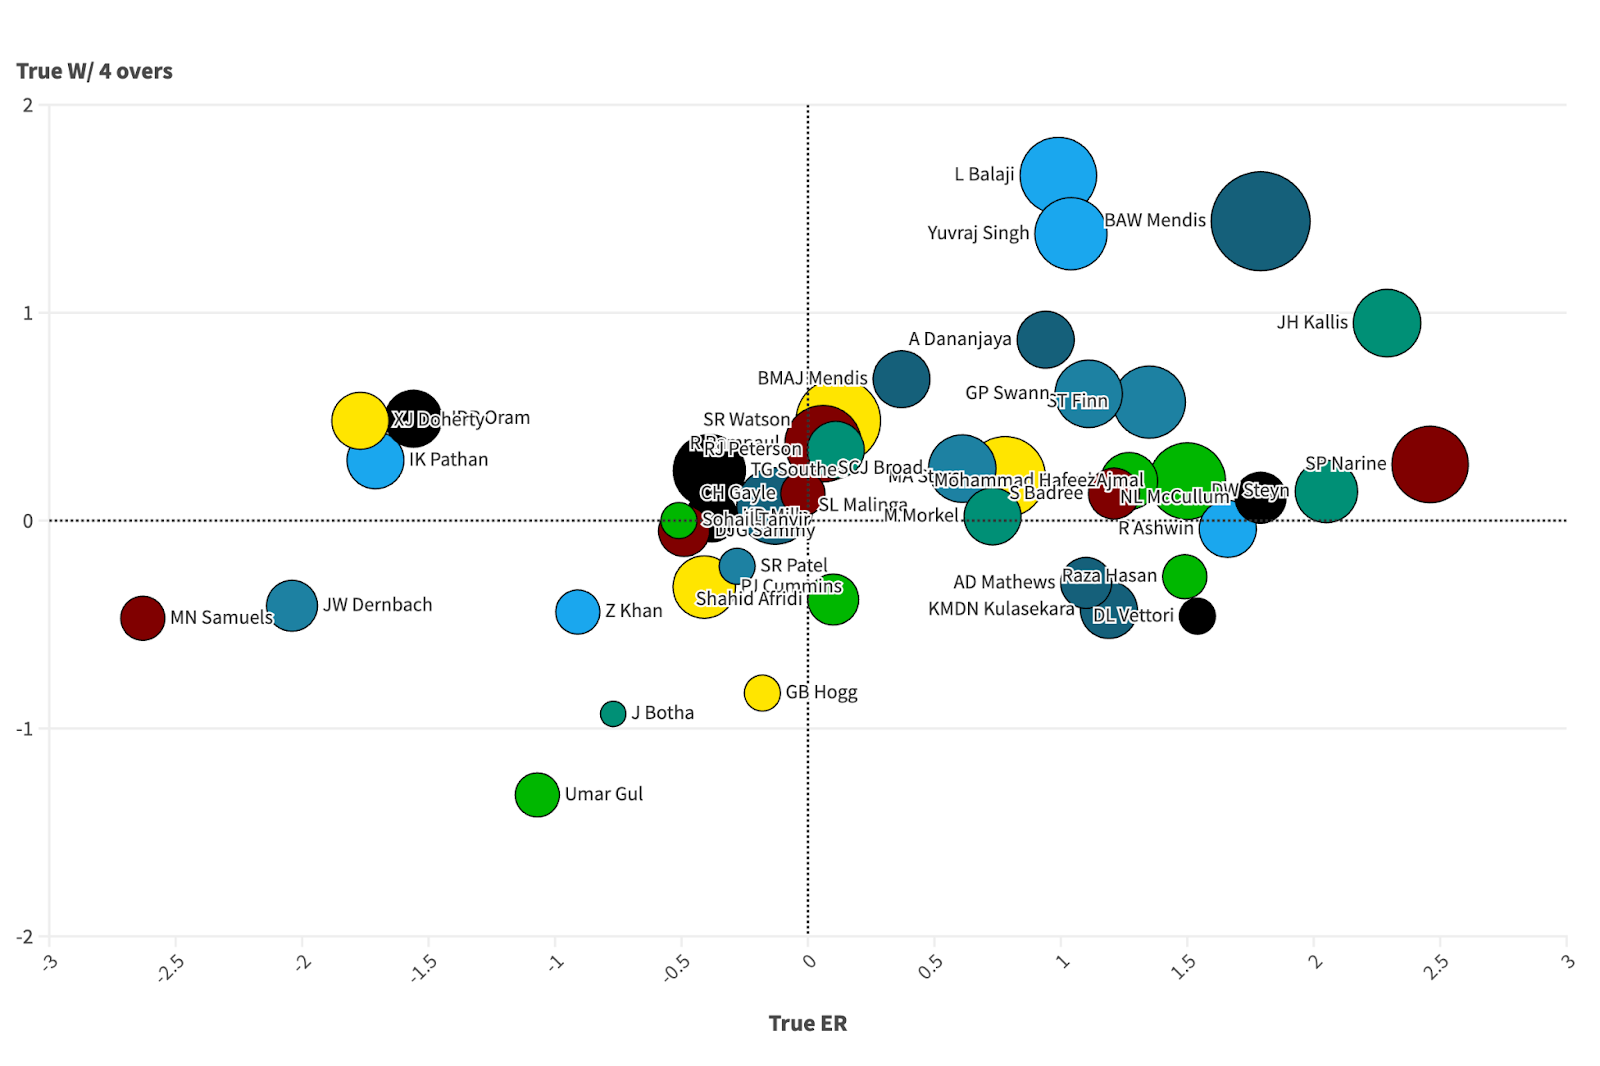
There are a few outliers here. This was peak Narine. And the T20 World Cup was no different. A true economy rate of 2.46 and 0.27 true wickets per four overs. He was at his economical best. We also see the South African duo of Kallis and Steyn here. Kallis especially being brilliant, a true economy rate of 2.29 and 0.95 true wickets per four overs. Steyn was par in terms of true wickets but had a true economy rate of 2.05.
Let’s take a look at the true wickets side now. Lakshmipathy Balaji, Ajantha Mendis and Yuvraj Singh top the chart. Balaji had a true economy rate of 0.99 and 1.66 true wickets per four overs. It was an unbelievable campaign, and one that’s forgotten.
Yuvraj again was brilliant with a true economy rate of 1.04 and 1.38 true wickets per four overs. He was past his peak with the bat but the Sri Lankan pitches really helped his bowling. And we can’t forget Mendis. Mendis dominated 2008-2012 where no one could really pick him. A lot like Narine. He was the leading wicket taker with 15 wickets and had a true economy rate of 1.79 and 1.44 true wickets per four overs.
And since this was in SL, we see a lot of spinners like Dananjaya, Swann, Ajmal, Badree, and others do really well here. However it’s Steven Finn that quietly had a good T20 World Cup – eight wickets with a true economy rate of 1.35 and 0.57 true wickets per four overs. Finn was never really known for being economical but he was phenomenal in this T20 World Cup.
Let’s go onto our MVP. It’s Shane Watson. As a reminder he scored 249 runs with a true average of 29 and a true strike rate of 49. And with the ball he took 11 wickets at a true economy rate of 0.12 and a true wickets of 0.48. The superfecta. He was a frontline batter and a frontline bowler this T20 World Cup. When Watson was good, few were better. It really felt at times if he played well, Australia would win it all.

2014
Batting
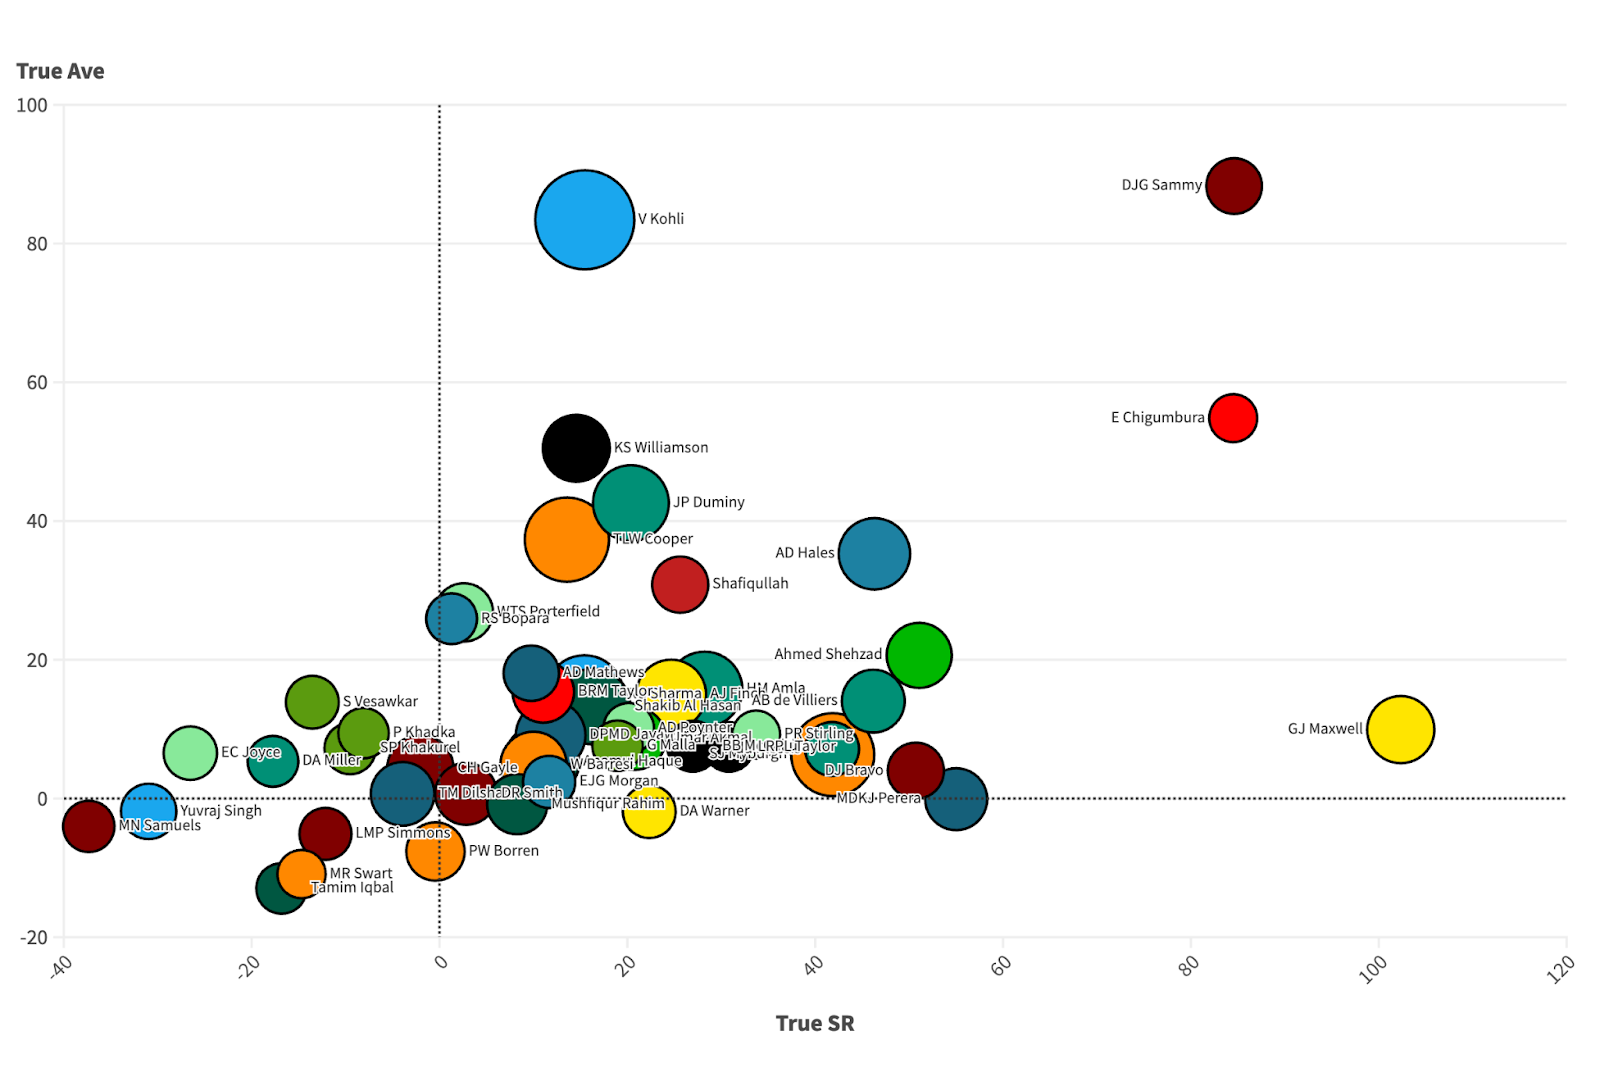
Let’s look at 2014. This was the arrival of Kohli as we know it. He was the leading run scorer in this tournament, 319 runs with a true average 83 and a true strike rate of 15.47. It was a sensational season. Although you do wonder whether Kohli could have traded some of the true average for more true strike rate – although we could also have that conversation at any time since. But we’re nitpicking an all time great season.
Another outlier is Darren Sammy. He had a true average of 88 and a true strike rate of 85. He scored 101 runs and was only dismissed once. He had a median entry point of 15.4 and in every sense was a finisher. Chigumbura also had a great season he had a true average of 55 and a true strike rate of 85.
Let’s look at the freak on the far right. Glenn Maxwell, the big show. He had a true strike rate of 102. That means he scored a run more than expected for every ball he faced. And a true average of 10. I don’t think people realise how insane this is. And he scored 147 runs, so it’s a decent sample size. Maxwell was the batter that made the world realise the importance of attacking the middle overs. And he did it in a way no else did.
Let’s look at the next cluster of batters and there’s a few interesting ones here. Kane Williamson did what he does, he anchored the innings at a great true average of 50 and a decent true strike rate of 15. JP Duminy again does what Kane and Virat did, having a great true average at a decent true strike rate.
However, let's talk about Tom Cooper. This Dutch batter is the 2nd highest run scorer of this T20 World Cup with 231 runs at a true average of 37 and a true strike rate of 14. We must appreciate how good he was here.
We also need to talk about Alex Hales. At his best, he was one of the best white ball batters in the world. And this T20 World Cup is no different, he had a true strike rate of 46 and a true average of 35. Remember this was when England were terrible and didn’t support this style of play.
Ahmed Shehzad had a true strike rate of 51 and a true average of 21. He was someone who had a lot of talent and promise but never really managed to make the most out of it. But if we talk about this specific tournament, 111 of his 138 runs came in one innings against Bangladesh. This means he only made 27 runs in three innings against India, Australia and West Indies.
Bowling
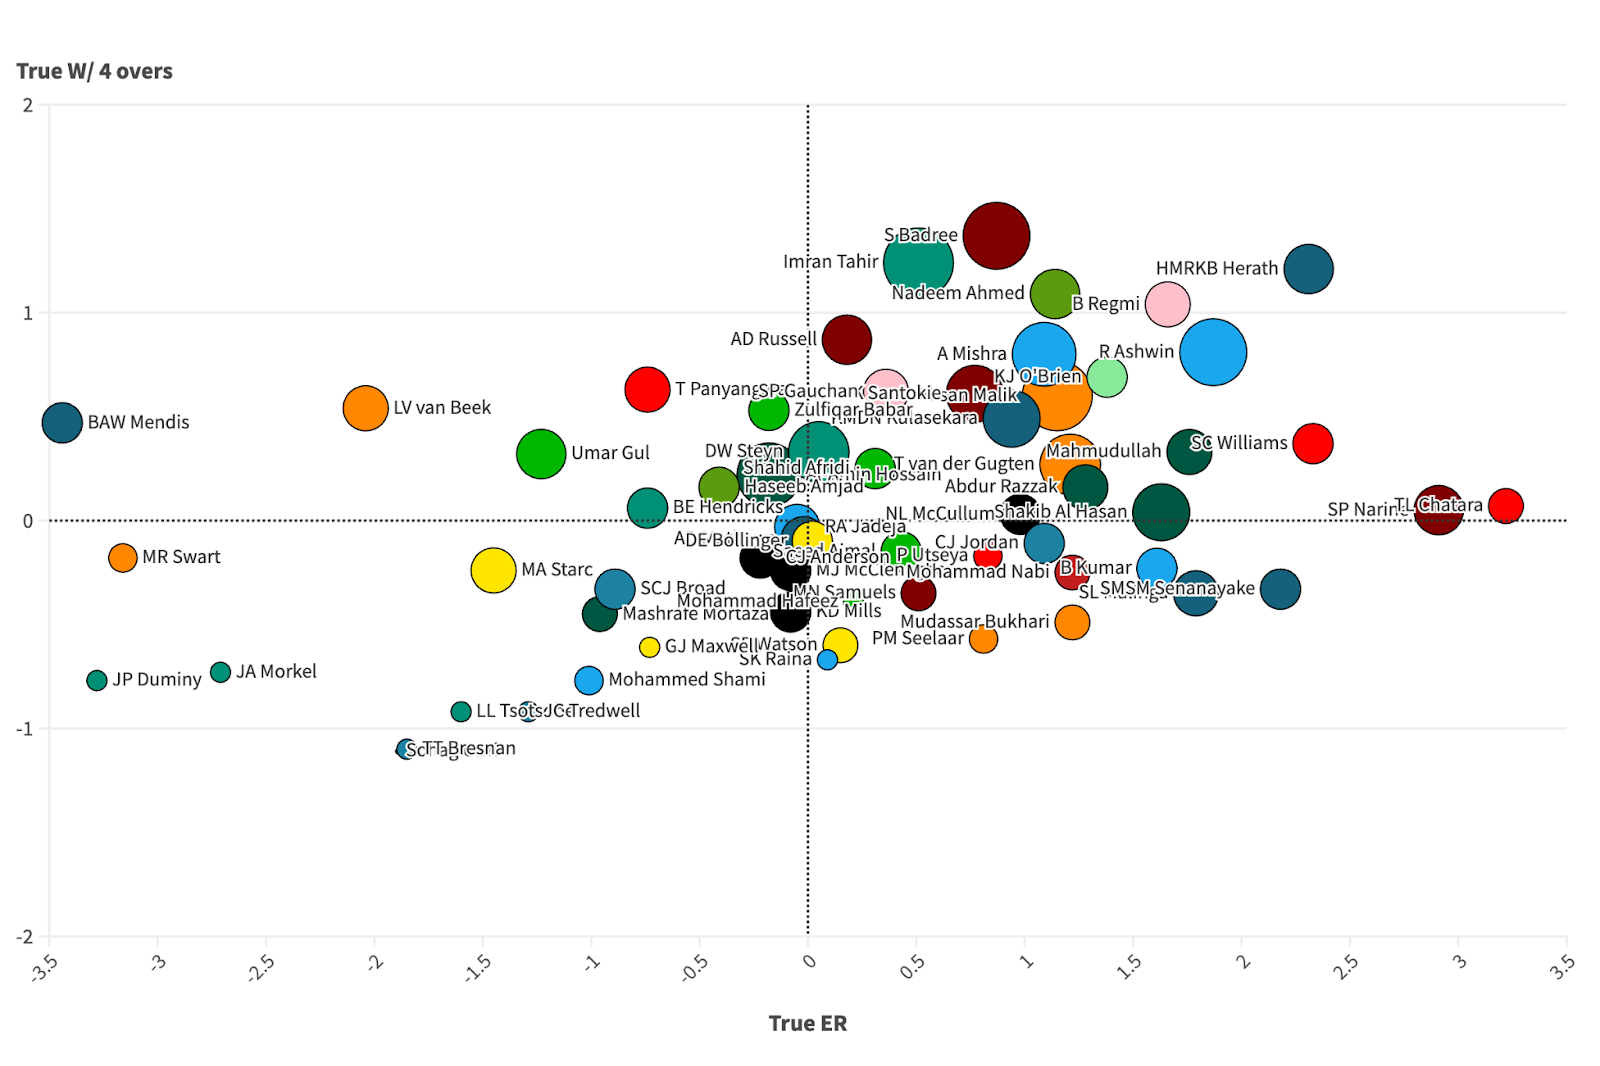
Chatara did the unthinkable here. He was more economical than peak Narine. He had a true economy rate of 3.22, and was par on true wickets. Narine though was not that far behind with a true economy rate of 2.91, and he was also par on true wickets. Both were exceptional defensive seasons. In fact, you could argue that when you are this defensive you’re essentially attacking.
Though the bowler that shines here is Rangana Herath. And if we know one thing it’s that Bangladesh pitches aid SLA’s. He had a true economy rate of 2.31 and 1.21 true wickets per four overs. He is known for taking 400 wickets in Test cricket but at his best he was a very handy T20 bowler. In this T20 World Cup, he was elite.
Although not an SLA, R Ashwin was not too far off him. He was the joint second highest wicket taker with 11 wickets and took them at a true economy rate of 1.87 and 0.81 true wickets per four overs.
Let’s also take a look at another man who took 11 wickets. Samuel Badree. He is quite possibly the most underrated bowler in T20 history. He was a powerplay spinner when we didn’t know that was a speciality. Enough ranting, let’s look at his numbers. He had a true economy rate of 0.87 and 1.37 true wickets per four overs.
You may be wondering who the leading wicket taker is. Let me give you a hint, when he takes a wicket, he ends up running a 5k. It’s Imran Tahir. He had a true economy rate of 0.51 and 1.24 true wickets per four overs. He was sensational, and at his best he took wickets consistently in the middle overs.
Another bowler that had a sneaky good season was Amit Mishra. We know that he’s still playing this IPL season. But before that, he took 10 wickets at a true economy rate of 1.09 and 0.8 true wickets per four overs in a T20 World Cup.
Virat Kohli was the MVP by ICC and we don’t really have much reason to dispute it. He scored 319 runs with a true average of 83 and a true strike rate of 15.47, and the highlight of that campaign has to be his unbeaten 72 against South Africa in the semi-final. He was brilliant.

2016
Batting
Other than ruining our chart, 2016 was Kohli’s T20 World Cup. And our advanced numbers support that, he had a true average of 113 and a true strike rate of 19. Not as many runs as his 2014 season, but you have to say that this season he had a greater impact for his team. That increase in true strike rate by a bit was valuable. But like 2014, if we had to nitpick an all time season, it would be whether he could sacrifice the true average for true strike rate. But we do need to acknowledge that the Indian batting lineup was quite inconsistent in that T20 World Cup, with Rohit being seen on the wrong extreme here.
Let’s look at some of the other outliers here. Even in his last T20 World Cup, Shahid Afridi managed to be at the extreme end of the true strike rate. What this man would have done in T20s at his peak is something we can only imagine. He had a true average of 2.4 and a true strike rate of 49.
Alongside him is Gayle, again. He had a strange T20 World Cup, because he scored a 100 but didn’t do much in the other innings. Guptill, de Villiers, Buttler, Roy and Sharjeel are others who had a phenomenal true strike rate around the 35 mark. England’s shift in mindset is truly evident here with Buttler, Roy and even Root having such high true strike rate campaigns.
In terms of true average, Angelo Mathews managed a true average of 95 at a par true strike rate. Fletcher also has a great true average but does it at a true strike rate of 14. MS Dhoni had an interesting season. He was barely dismissed with a true average of 71 and a true strike rate of -7, but in his case it would have definitely made more sense to sacrifice the true average for a better true strike rate.
Let’s also talk about the highest run scorer, Tamim Iqbal. Kohli’s season takes so much limelight we actually forget that Tamim led the runs chart. And our advanced metrics really support his case as well with a true average of 57 and a true strike rate of 33. However, he scored 62 runs in three innings against Pakistan, India and New Zealand at a strike rate of 103.33 in the Super 10.
Bowling
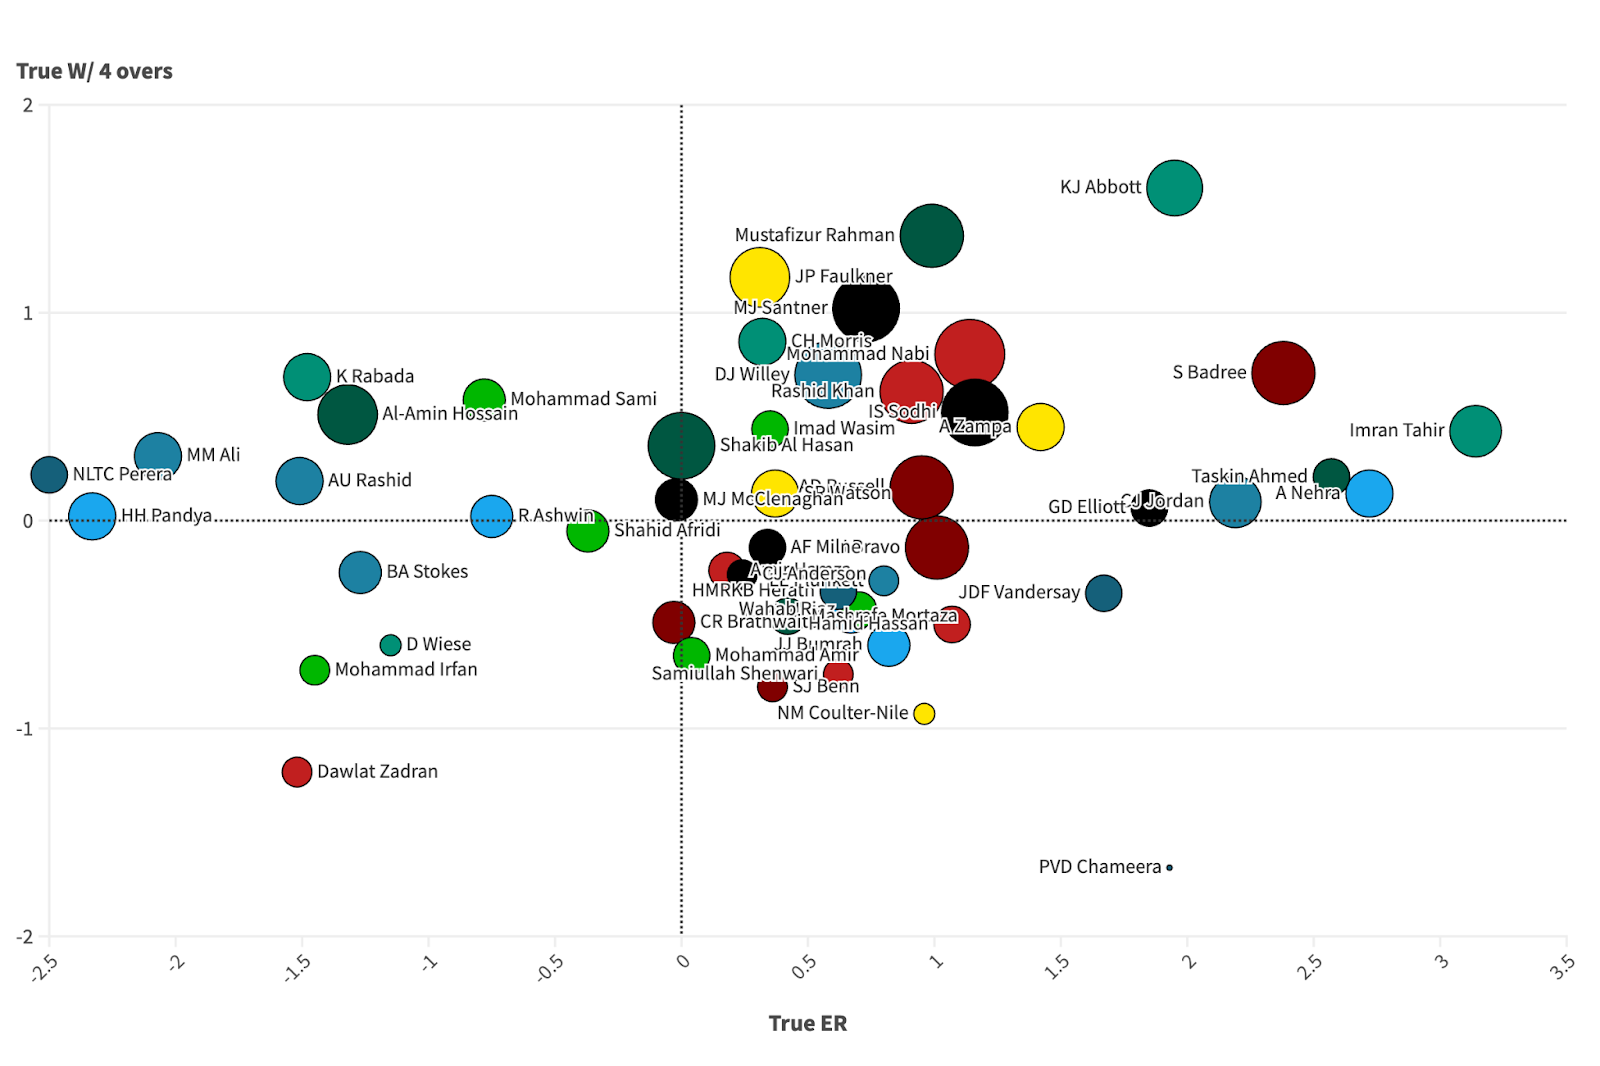
We have two outliers here, the South African duo of Kyle Abbott and Imran Tahir. Imran Tahir had a sensational season with a true economy rate of 3.14 and 0.43 true wickets per four overs. On this side we also have Ashish Nehra, who made a comeback in 2016 and definitely made most of it. He had a true economy rate of 2.72 and was slightly above par on true wickets. Taskin Ahmed had similar numbers as well, though he played only three games and bowled 10 overs.
Let’s look at Samuel Badree again. Back to back brilliant world cups for him, nine wickets at a true economy rate of 2.38 and 0.71 true wickets per four overs. Their batting gets a lot of credit for their T20 World Cup wins but Badree played an integral part in their success. It’s not a surprise that they haven’t reached the same heights once Badree called it quits.
On the true wickets side we have Kyle Abbott. The South African seamer took seven wickets a true economy rate of 1.95 and 1,.6 true wickets per four overs. He takes a wicket and a half more per spell than expected. That’s unbelievable.
We also see Mustafizur Rehman here. This was the arrival of Fizz at the big stage. He took nine wickets at a true economy rate of 1 and 1.37 true wickets per four overs. Alongside him we also see James Faulkner and Mitch Santner who both had fantastic seasons as well. Faulkner was starting to go past his prime – due to the knee injury – but he still delivered here.
Let’s talk about someone who doesn’t get talked about a lot, David Willey. In this T20 World Cup, he took 10 wickets at an economy rate of 0.58 and 0.7 true wickets per four overs. What makes these special is that seven of these wickets came in the powerplay, something which England are still trying really hard to replicate.
This was also where we started to see the rise of Rashid Khan and Mohammed Nabi. Both featured in the true economy rate and true wickets section with nine and eleven wickets respectively.
Also side note, can we talk about Chameera here? It’s truly impressive for someone to be this economical and this bad at taking wickets.
Let’s talk about our MVP. It has to be Virat Kohli. It’s really hard to look past his incredible World Cup performance. Badree winning the title probably has a shout, but Kohli was unreal when India was clearly not that good. It was clearly the outlier of this year.

That is it for part two of our MVP series.